This page was generated from: notebooks/nanopores/how_to_select_a_region_of_interest_using_ffts.ipynb
[1]:
%load_ext autoreload
%autoreload 2
%config InlineBackend.rc = {'figure.figsize': (10,6)}
%matplotlib inline
Select a region of interest using FFTs
This example shows how to crop an image using Nanomesh using the characteristics of an FFT to select a bbox matching the lattice of the crystal.
This example shows how to crop an image using sample data from nanomesh.data.
If you want to use your own data, any numpy array can be passed to into an Image object. This will create a `Volume <https://nanomesh.readthedocs.io/en/latest/nanomesh.volume.html#nanomesh.volume.Volume>`__ or `Plane <https://nanomesh.readthedocs.io/en/latest/nanomesh.plane.html#nanomesh.plane.Plane>`__ object depending on the data dimensions. Data stored as .npy can be loaded using Image.load().
[2]:
from nanomesh import Image
from nanomesh.data import nanopores3d

data = nanopores3d()

vol = Image(data)
plane = vol.select_plane(x=161)
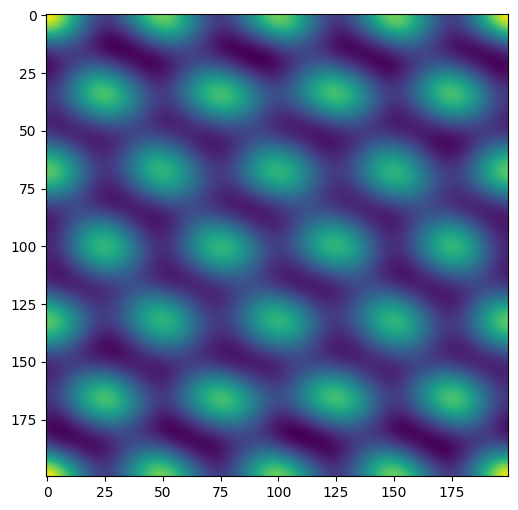
This operation takes the fft of the image, and creates a regular array of the recurring components. The distance between the peaks in the image correspond to the distance between the pores in the source image.
[3]:
import numpy as np
import matplotlib.pyplot as plt


def abs2(x):
    return x.real**2 + x.imag**2


fft = np.fft.fft2(plane.image)
ifft = np.fft.ifft2(abs2(fft))

filtered = abs(ifft)

plt.figure()
plt.imshow(filtered)
plt.show()
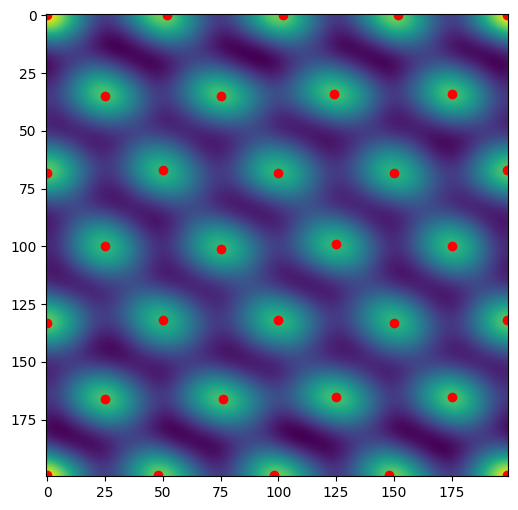
Peak-finding
Use a Difference of Gaussian to find the peaks in the image.
[4]:
from skimage import feature

peaks = feature.blob_dog(filtered,
                         min_sigma=10,
                         max_sigma=20,
                         overlap=1,
                         threshold=5)
peaks = peaks[:, 0:2]
x, y = peaks.T

plt.figure()
plt.imshow(filtered)
plt.scatter(y, x, color='red')
plt.show()
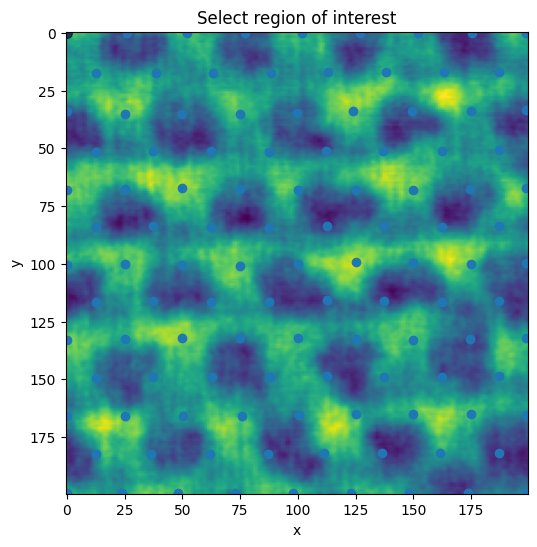
ROI picking
A Delauney triangulation is used to create a mesh out of the peaks. The mesh is subdivided once to create additional granularity for the point picking in the roi selection.
[5]:
from scipy.spatial import Delaunay
from nanomesh import TriangleMesh

tris = Delaunay(peaks)
triangles = TriangleMesh.from_scipy(tris)
The subdivision uses trimesh.
[6]:
trimesh = triangles.to_trimesh()
trimesh_subdivided = trimesh.subdivide()
triangles = TriangleMesh.from_trimesh(trimesh_subdivided)
The vertices are passed to the .select_roi method to pick from.
By passing
from_points, vertices snap to the nearest point (use ‘ctrl’ to drag it away)Press the ‘esc’ key to start a new polygon
Hold the ‘shift’ key to move all of the vertices
Hold the ‘ctrl’ key to move a single vertex
[7]:
roi = plane.select_roi(from_points=triangles.points)
The .bbox attribute is updated when the selection above changes.
[8]:
roi.bbox
[8]:
array([[0, 0],
       [0, 1],
       [1, 1],
       [1, 0]])
Use the .crop_to_roi method to extract the region of interest.
[9]:
plane_roi = plane.crop_to_roi(bbox=roi.bbox)
plane_roi.show()
[9]:
<AxesSubplot:xlabel='x', ylabel='y'>