This page was generated from: notebooks/nanopores/how_to_select_a_region_of_interest_from_an_image.ipynb
[1]:
%load_ext autoreload
%autoreload 2
%config InlineBackend.rc = {'figure.figsize': (10,6)}
%matplotlib inline
Select a region of interest
This example shows how to crop an image using sample data from nanomesh.data.
If you want to use your own data, any numpy array can be passed to into a `Volume <https://nanomesh.readthedocs.io/en/latest/nanomesh.volume.html#nanomesh.volume.Volume>`__ object. Data stored as .npy can be loaded using Volume.load().
[2]:
from nanomesh import Volume
from nanomesh.data import nanopores3d
data = nanopores3d()
vol = Volume(data)
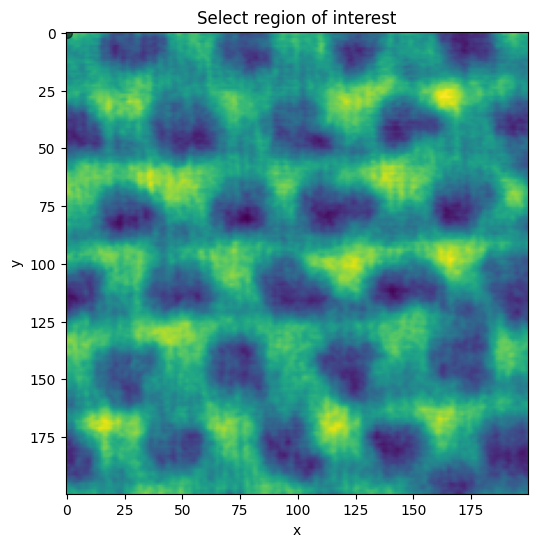
plane = vol.select_plane(x=161)
Use .select_roi to open an interactive widget. Select a region of interest in the figure by enclosing them within a polygon. A rectangle is fitted to the polygon.
Press the ‘esc’ key to start a new polygon
Hold the ‘shift’ key to move all of the vertices
Hold the ‘ctrl’ key to move a single vertex
[3]:
roi = plane.select_roi()
The .bbox attribute is updated when the selection above changes.
[4]:
roi.bbox
[4]:
array([[0, 0],
       [0, 1],
       [1, 1],
       [1, 0]])
Use the .crop_to_roi method to extract the region of interest.
[5]:
plane_roi = plane.crop_to_roi(bbox=roi.bbox)
plane_roi.show()
[5]:
<AxesSubplot:xlabel='x', ylabel='y'>
Manual cropping
Alternatively, if you know which points to extract from the to
Use the minimum_bounding_rectangle function to fit the smallest rectangle around the given points.
The example below demonstrates this on a slanted square. Well, almost, because the coordinates contain a small error to demonstrate the function.
[6]:
from nanomesh.image import minimum_bounding_rectangle
import numpy as np

roi = np.array([
    [60, 60],
    [110, 110],
    [60, 145],  # <- should be 150
    [10, 110],
])

bbox = minimum_bounding_rectangle(roi)
bbox
[6]:
array([[110., 110.],
       [ 60.,  60.],
       [ 10., 110.],
       [ 60., 160.]])
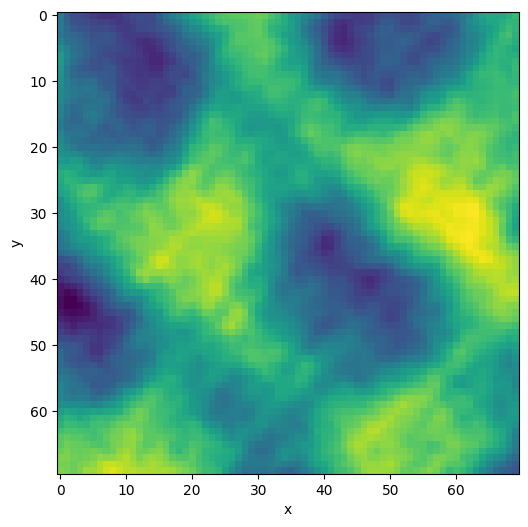
The bounding box (bbox) can then be used to extract this region from the image using extract_rectangle. If the bounding box is slanted, the image will be straightened using an Euclidean transform.
[7]:
from nanomesh.image import extract_rectangle

cropped = plane.apply(extract_rectangle, bbox=bbox)
cropped.show()
[7]:
<AxesSubplot:xlabel='x', ylabel='y'>