This page was generated from: notebooks/examples/how_to_crop_meshes.ipynb
[1]:
%config InlineBackend.rc = {'figure.figsize': (10,6)}
%matplotlib inline
%load_ext autoreload
%autoreload 2
How to crop meshes
This notebook shows how a 2D and 3D mesh can be cropped.
2D triangle mesh
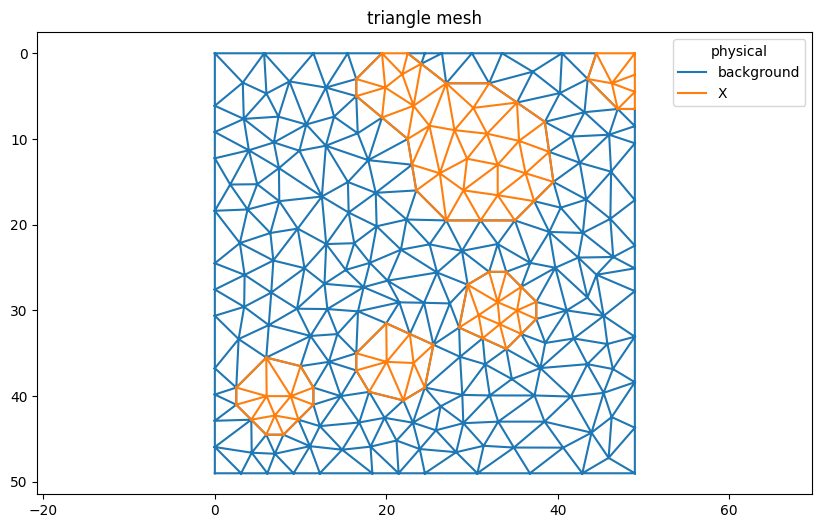
Generate a 2D sample mesh using the data module.
[2]:
from nanomesh.data import blob_mesh2d
mesh = blob_mesh2d(seed=2)
triangles = mesh.get('triangle')
triangles.plot()
{1, 2}
[2]:
<AxesSubplot:title={'center':'triangle mesh'}>
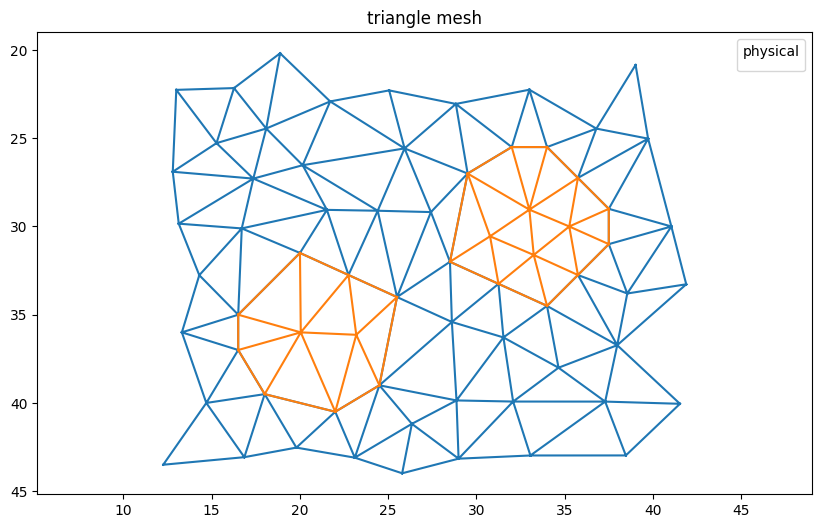
Crop the mesh using the crop() method. Note that it is not necessary to specify all parameters.
[3]:
cropped_triangles = triangles.crop(
    xmin=20,
    xmax=45,
    ymin=12,
    ymax=42,
)
cropped_triangles.plot()
{1, 2}
[3]:
<AxesSubplot:title={'center':'triangle mesh'}>
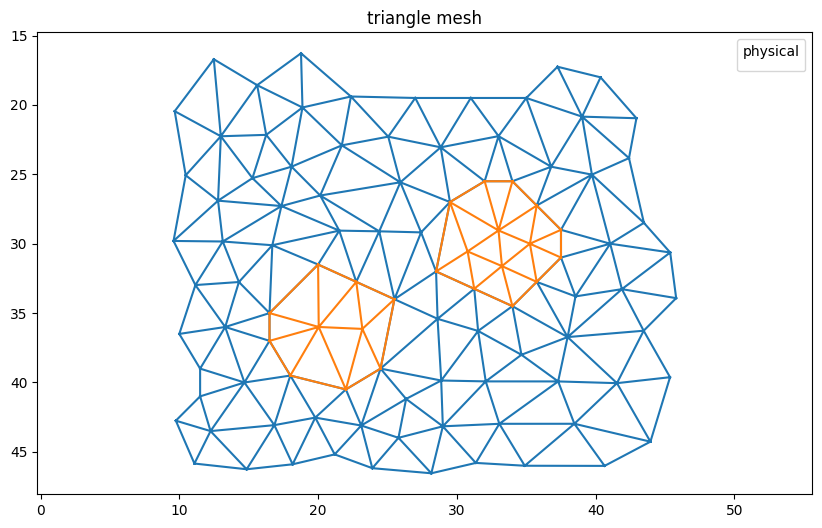
To include partial triangles (i.e. those which lie on the cropping boundaries), use the include_partial argument.
[4]:
cropped_triangles2 = triangles.crop(
    xmin=20,
    xmax=45,
    ymin=12,
    ymax=42,
    include_partial=True,
)
cropped_triangles2.plot()
{1, 2}
[4]:
<AxesSubplot:title={'center':'triangle mesh'}>
3D tetrahedral mesh
Using the data submodule, a 3D sample mesh can be generated.
[5]:
from nanomesh.data import blob_mesh3d
mesh = blob_mesh3d(opts='-pq1.2Aa', length=10, seed=2)
tetras = mesh.get('tetra')
tetras
[5]:
TetraMesh(
    points = (1352, 3),
    cells = (6391, 4),
    fields = ('background', 'X'),
    region_markers = (),
    cell_data = ('tetgen-ref',),
)
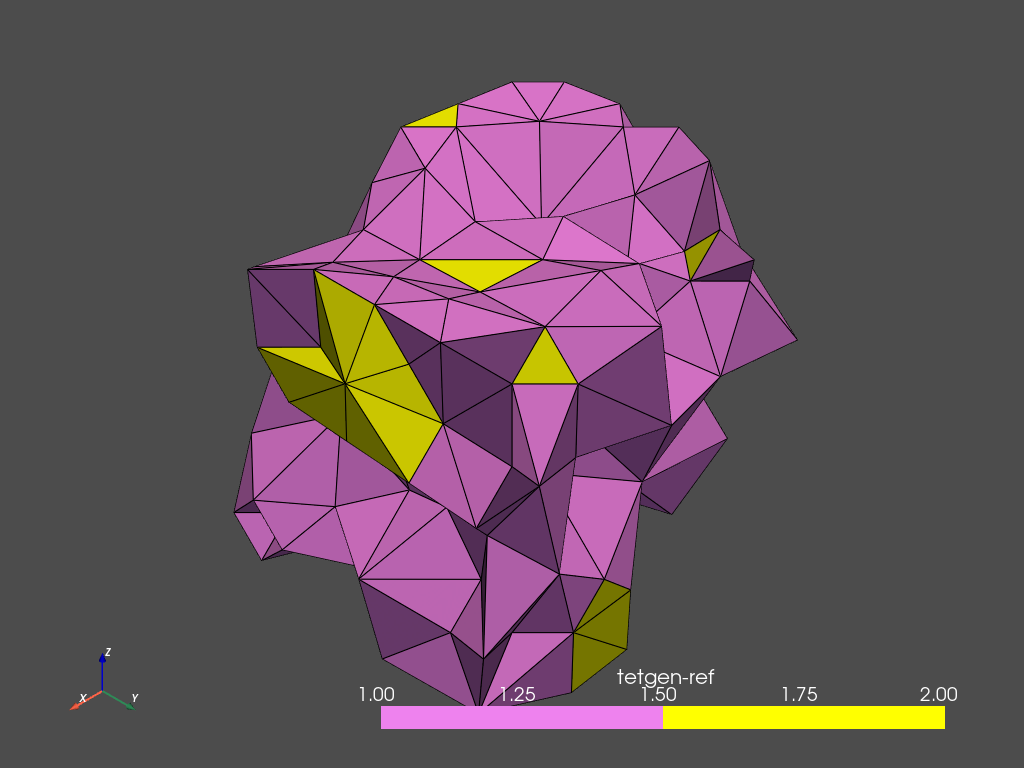
3D meshes can be cropped using the same interface.
[6]:
new = tetras.crop(
    xmin=2,
    xmax=8,
    ymin=2,
    ymax=7,
    zmin=2,
    zmax=7
)
new.plot_pyvista(
    jupyter_backend='static',
    show_edges=True,
    cmap=['violet', 'yellow'],
)