This page was generated from: notebooks/examples/how_to_pad_a_2d_mesh.ipynb
[1]:
%load_ext autoreload
%autoreload 2
%config InlineBackend.rc = {'figure.figsize': (10,6)}
%matplotlib inline
Pad a 2D mesh
This notebook shows how to pad a 2D mesh. Note that padding a 2d mesh is done on the contour (before triangulation).
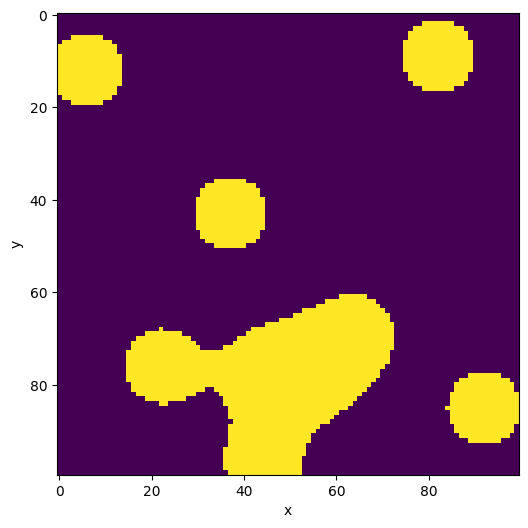
Generating some data
This cell generates a simple 2d plane.
If you want to use your own data, any numpy array can be passed to into a `Image <https://nanomesh.readthedocs.io/en/latest/nanomesh.plane.html#nanomesh.volume.Plane>`__ object. Data stored as .npy can be loaded using Image.load().
[2]:
from nanomesh.data import binary_blobs2d
from nanomesh import Image

data = binary_blobs2d(length=100, seed=42)

plane = Image(data)
plane.show()
[2]:
<AxesSubplot:xlabel='x', ylabel='y'>
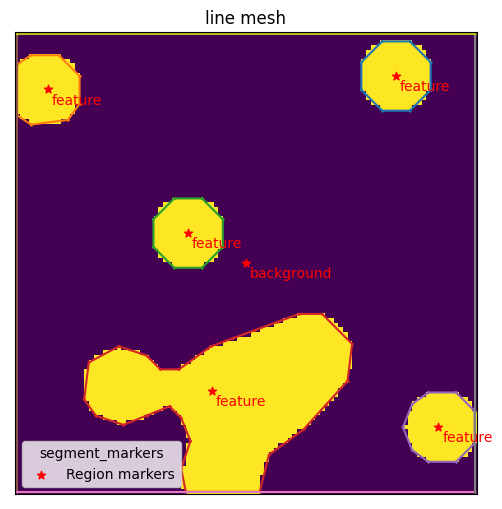
Generating the contour
The first step in mesh generation is to generate the contour.
[3]:
from nanomesh import Mesher2D

mesher = Mesher2D(plane)
mesher.generate_contour()
mesher.plot_contour(legend='fields')
[3]:
<AxesSubplot:title={'center':'line mesh'}>
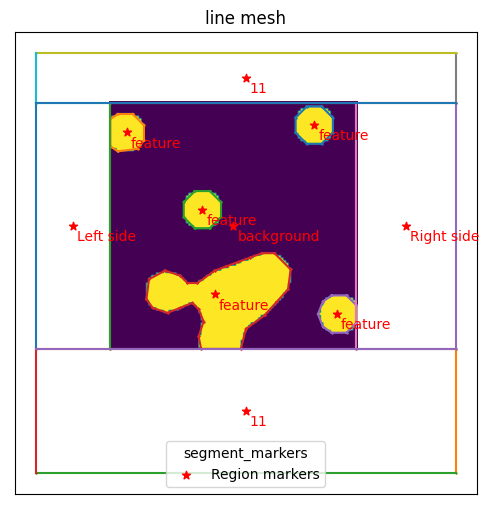
Padding different sides
The mesh can be padded using a similar API as 3d meshes. Each side (top/bottom, left/right) can be padded. A width must be specified.
Regions are labeled with a number. If no label is given, an arbitrary number is assigned. This is used to identify different regions in the mesh.
Padded areas can be given a name. Regions with the same name are assigned the same number.
[4]:
mesher.pad_contour(side='left', width=30, name='Left side')
mesher.pad_contour(side='right', width=40, name='Right side')
mesher.pad_contour(side='top', width=20, label=11)
mesher.pad_contour(side='bottom', width=50, label=11)
mesher.plot_contour(legend='fields')
[4]:
<AxesSubplot:title={'center':'line mesh'}>
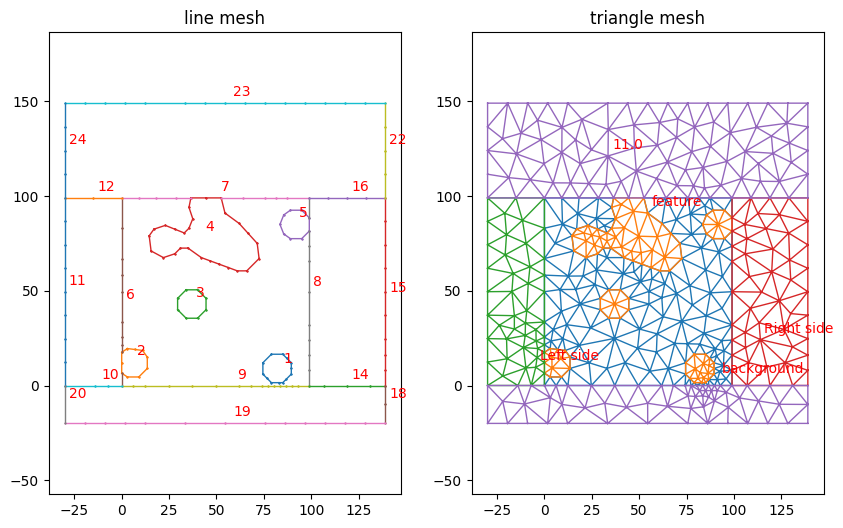
Generate triagonal mesh
Finally, generate the triagonal mesh.
Note that the legend specifies the name of the region if available in the .fields attribute.
[5]:
mesh = mesher.triangulate(opts='pAq30a100e')
mesh.plot(legend='floating', hide_labels=(0, ), linewidth=1)
[5]:
(<AxesSubplot:title={'center':'line mesh'}>,
 <AxesSubplot:title={'center':'triangle mesh'}>)
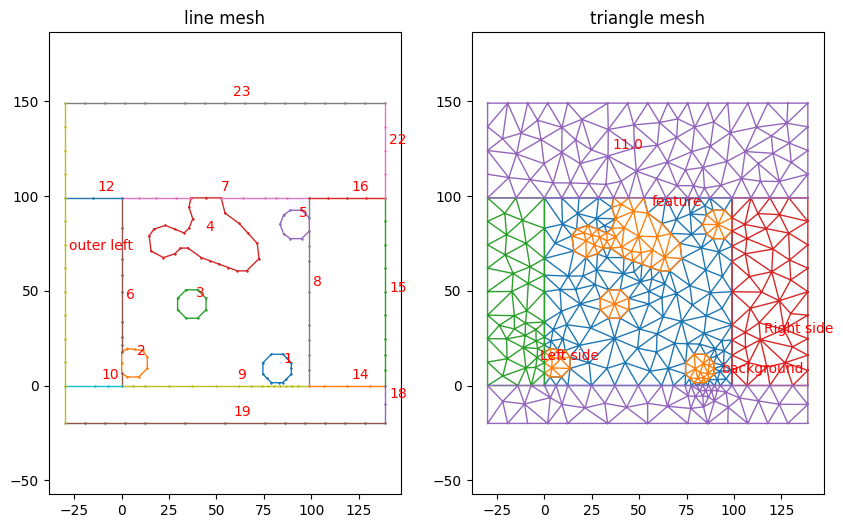
Labelling outer boundaries
The outer boundaries can be labeled using the LineMesh.label_boundaries method.
The default .cell_data key is 'physical'. This can be overridden using the key='...' parameter. To label the top and bottom boundaries, use the top, bottom parameters.
[6]:
line_mesh = mesh.get('line')

line_mesh.label_boundaries(left='outer left', right='outer right')

# transfer labels back to MeshContainer
mesh.set_cell_data('line', 'physical', line_mesh.cell_data['physical'])
mesh.set_field_data('line', line_mesh.number_to_field)

mesh.plot(legend='floating', hide_labels=(0, ), linewidth=1)
[6]:
(<AxesSubplot:title={'center':'line mesh'}>,
 <AxesSubplot:title={'center':'triangle mesh'}>)
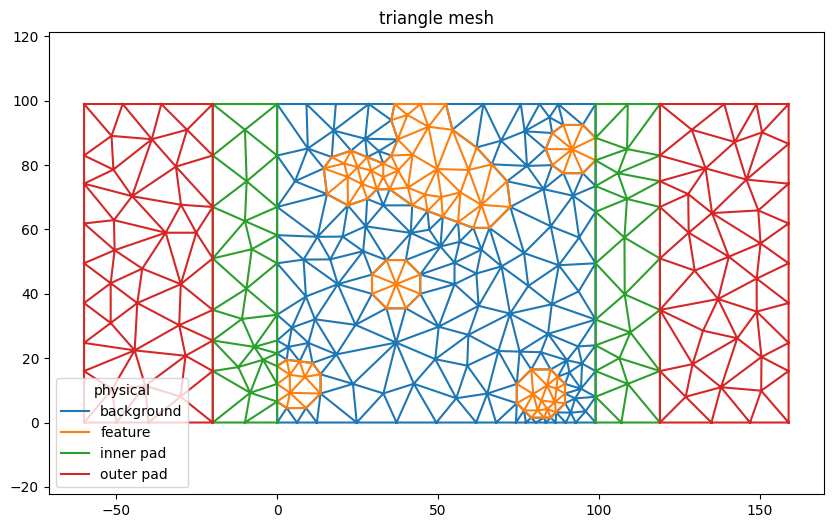
Padding left / right sides
The width, mesh quality, and label assigned to this this area can be defined.
This example shows how to double pad the left and right sides with different triangle sizes for each step.
[7]:
mesher = Mesher2D(plane)
mesher.generate_contour()

mesher.pad_contour(side='left', width=20, label=30, name='inner pad')
mesher.pad_contour(side='left', width=40, label=40, name='outer pad')

mesher.pad_contour(side='right', width=20, label=30, name='inner pad')
mesher.pad_contour(side='right', width=40, label=40, name='outer pad')

padded_mesh = mesher.triangulate(opts='pAq30a100e')

padded_mesh.plot('triangle', legend='fields')
[7]:
<AxesSubplot:title={'center':'triangle mesh'}>
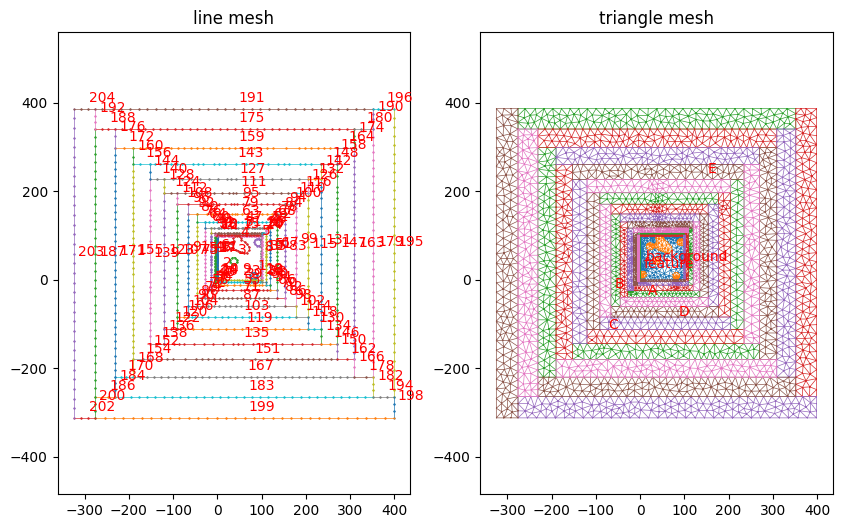
Spiral mesh
This pattern is infinitely extensible. The example below shows the flexibility of the method.
[8]:
from itertools import cycle
import numpy as np

mesher = Mesher2D(plane)
mesher.generate_contour()

choices = ('left', 'bottom', 'right', 'top')

for i, side in zip(range(1, 50), cycle(choices)):
    name = 'ABCDE'[i % 5]
    mesher.pad_contour(side=side, width=i, name=name)

spiral_mesh = mesher.triangulate(opts='pAq30a200e')

spiral_mesh.plot(legend='floating', hide_labels=(0, ), linewidth=0.5)
[8]:
(<AxesSubplot:title={'center':'line mesh'}>,
 <AxesSubplot:title={'center':'triangle mesh'}>)