This page was generated from: notebooks/other/hello_world.ipynb
[1]:
%config InlineBackend.rc = {'figure.figsize': (10,6)}
%matplotlib inline
Hello world!
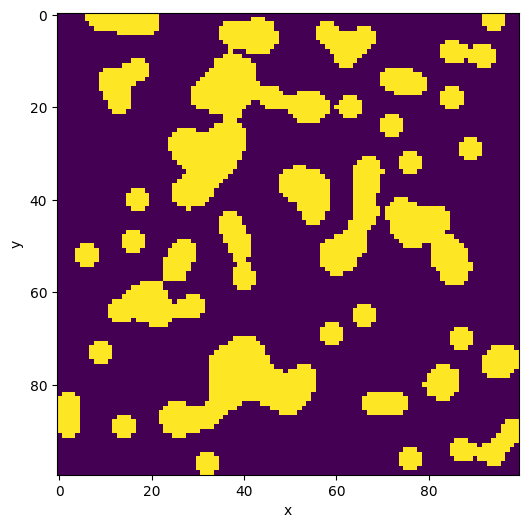
This example shows the workflow for generating a mesh from segmented data, and demonstrates a few of the features of Nanomesh. It uses a synthetic binary image with several rounded blob-like objects generated by skimage.
Image data in Nanomesh is stored as an nanomesh.Image type. Calling nanomesh.Image will create the appropriate subtype, nanomesh.Plane for 2D or nanomesh.Volume for 3D data.
[2]:
from skimage.data import binary_blobs
from nanomesh import Image

blobs = binary_blobs(length=100, volume_fraction=0.25, seed=2102)
plane = Image(blobs)

print(plane)
Plane(shape=(100, 100), range=(False,True), dtype=bool)
nanomesh.Image is essentially a container for a numpy array with some methods for image segmentation and visualization.
[3]:
plane.show()
[3]:
<AxesSubplot:xlabel='x', ylabel='y'>
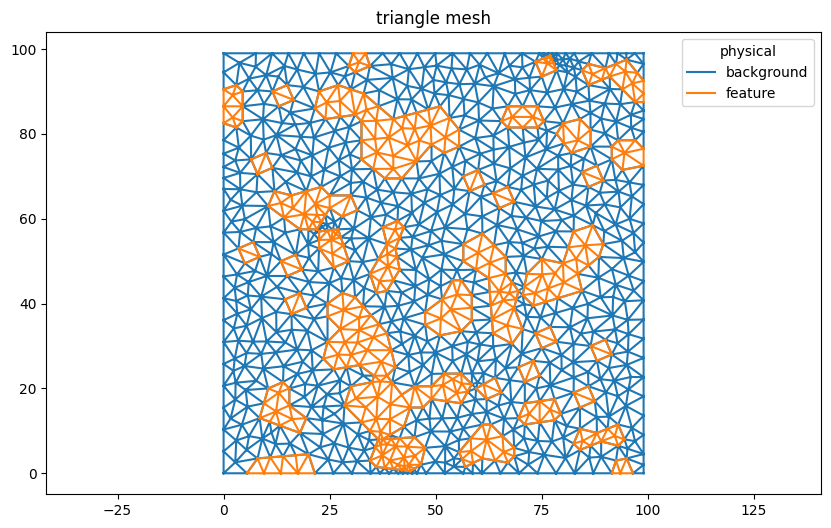
Generating a mesh from image data is simple in Nanomesh using nanomesh.Plane.generate_mesh(). The options opts are passed to the triangulation function (nanomesh.triangulate()). In this example, we use q30 to generate a quality mesh with minimum angles of 30°, and a50 to limit the triangle size to 50 pixels.
The returned mesh is a nanomesh.MeshContainer with the generated triangles and line segments.
[4]:
mesh = plane.generate_mesh(opts='q30a10')
mesh
[4]:
<MeshContainer>
  Number of points: 932
  Number of cells:
    triangle: 1754
    line: 2685
  Point data: physical
  Cell data: physical
  Field data: feature, background
In the next cell, we plot the triangles.
[5]:
mesh.plot('triangle')
[5]:
<AxesSubplot:title={'center':'triangle mesh'}>
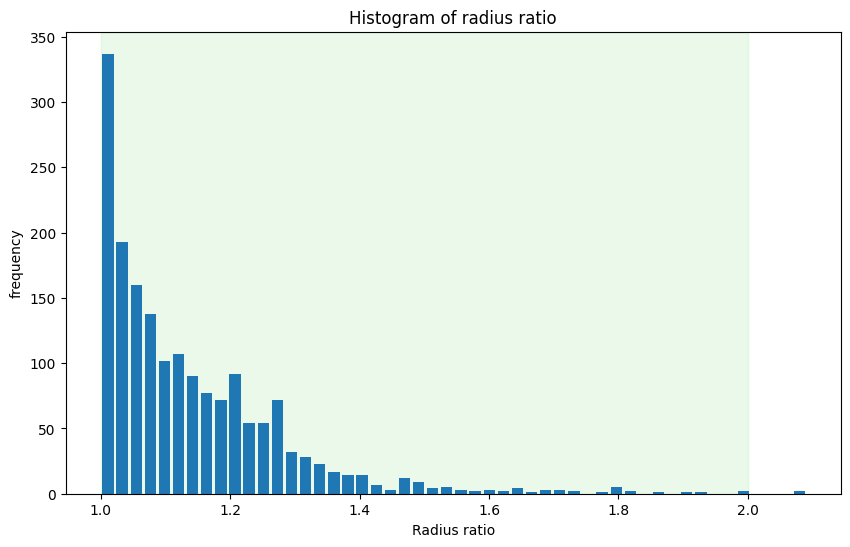
Nanomesh can also calculate cell quality metrics and show them as a colored triangle or histogram plot.
Note that the area shaded in green below highlights the optimal range.
Have a look at the nanomesh.metrics submodule or in the example: Calculate mesh quality metrics.
[6]:
from nanomesh import metrics

triangle_mesh = mesh.get('triangle')

metrics.histogram(triangle_mesh, metric='radius_ratio')
[6]:
<AxesSubplot:title={'center':'Histogram of radius ratio'}, xlabel='Radius ratio', ylabel='frequency'>
Nanomesh uses [meshio](https://github.com/nschloe/meshio) to write data to most meshing formats.
[7]:
mesh.write('mesh.vtk')
Warning: VTK requires 3D points, but 2D points given. Appending 0 third component.
For more practical examples of how to use Nanomesh, check out the how-to guides and notebooks: Overview.