This page was generated from: notebooks/nanopores/how_to_calculate_cell_quality_metrics.ipynb
[1]:
%load_ext autoreload
%autoreload 2
%config InlineBackend.rc = {'figure.figsize': (10,6)}
%matplotlib inline
Calculate mesh quality metrics
This notebook reads a mesh and plots different quality indicators:
Minimum/maximum angle
Ratio min/max edge length
Ratio circumscribed to inscribed circle (largest circle fitting inside vs smallest circle fitting around a triangle)
The indicators are plotted on the mesh and as a histogram.
You can use your own mesh by supplying it to MeshContainer.read().
[2]:
from nanomesh import metrics
from nanomesh import MeshContainer
[3]:
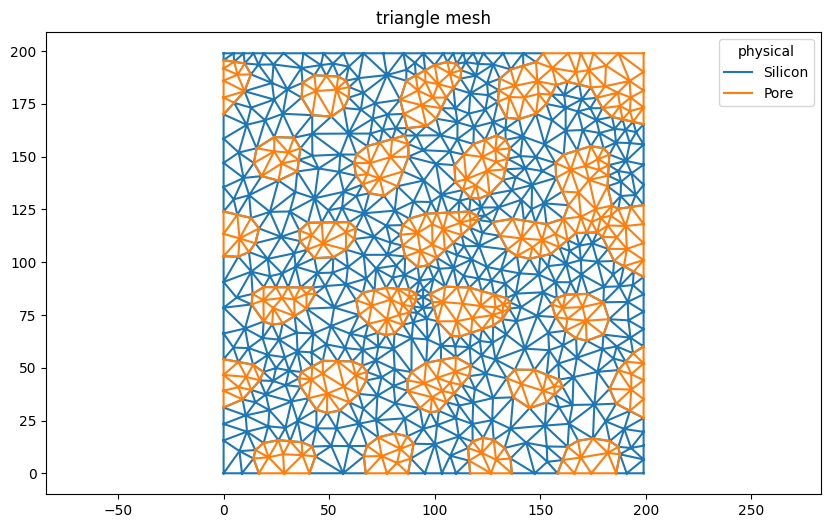
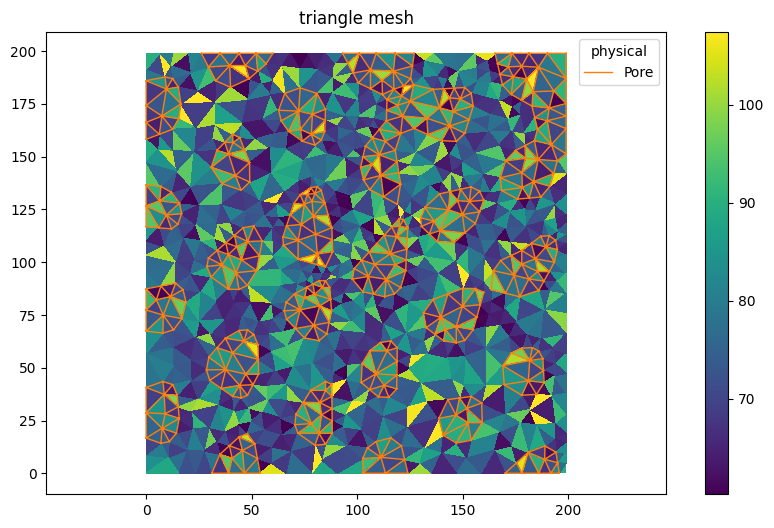
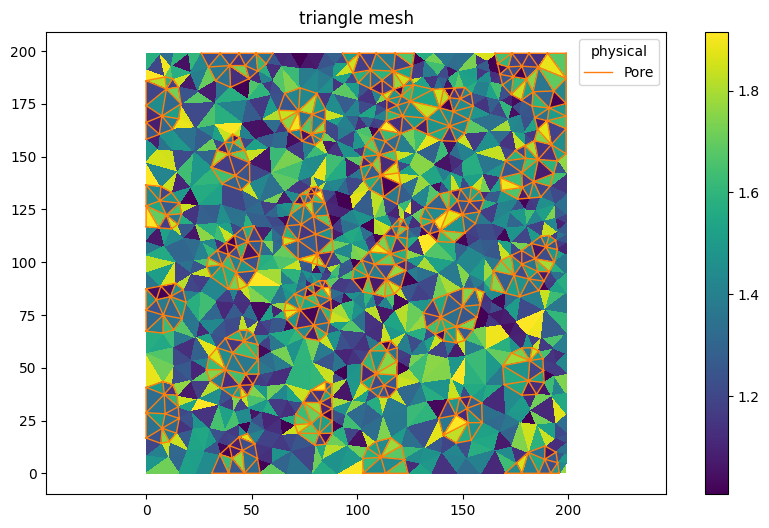
mesh = MeshContainer.read('out.msh')
triangle_mesh = mesh.get('triangle')

triangle_mesh.plot()
[3]:
<AxesSubplot:title={'center':'triangle mesh'}>
Metrics
Quality metrics are available through the metrics submodule, for example to access the area for each face:
[4]:
metrics.area(triangle_mesh)
[4]:
array([39.65259243, 45.70571101, 17.81927029, ..., 38.98781136,
       43.35816492, 41.13174034])
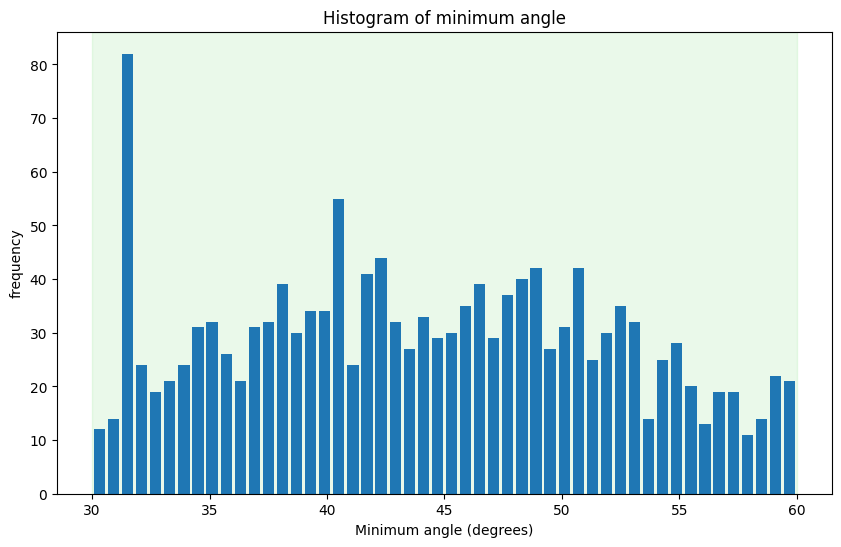
Minumum and maximum cell angles
nanomesh.metrics includes convenience functions for plotting histograms and colored 2d meshes. The ax object can be re-used to overlay the mesh triangles.
[5]:
plot_kwargs = {
    'linewidth': 1,
    'show_labels': ('Pore', ),
    'colors': ('tab:orange', ),
    'flip_xy': False,
    'legend': 'all',
}

metrics.histogram(triangle_mesh, metric='min_angle')
ax = metrics.plot2d(triangle_mesh, metric='min_angle')
triangle_mesh.plot_mpl(ax, **plot_kwargs)
[5]:
<AxesSubplot:title={'center':'triangle mesh'}>
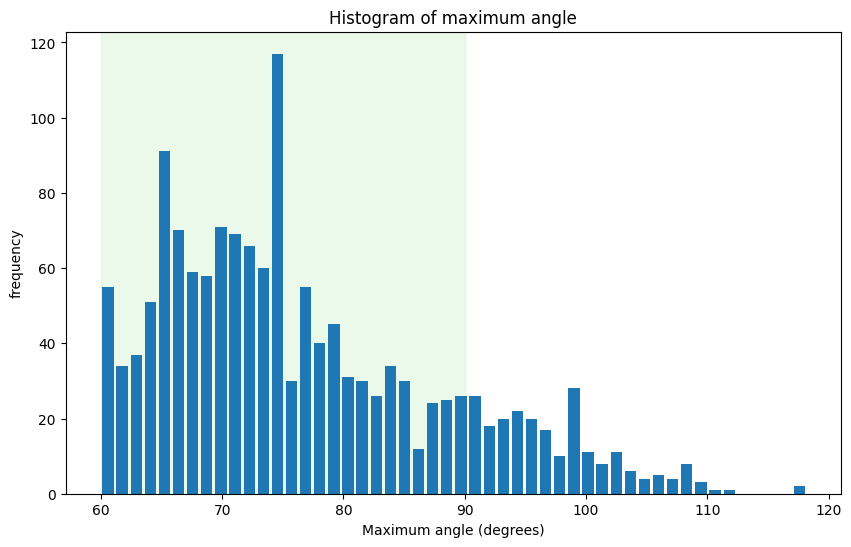
[6]:
metrics.histogram(triangle_mesh, metric='max_angle')
ax = metrics.plot2d(triangle_mesh, metric='max_angle')
triangle_mesh.plot_mpl(ax, **plot_kwargs)
[6]:
<AxesSubplot:title={'center':'triangle mesh'}>
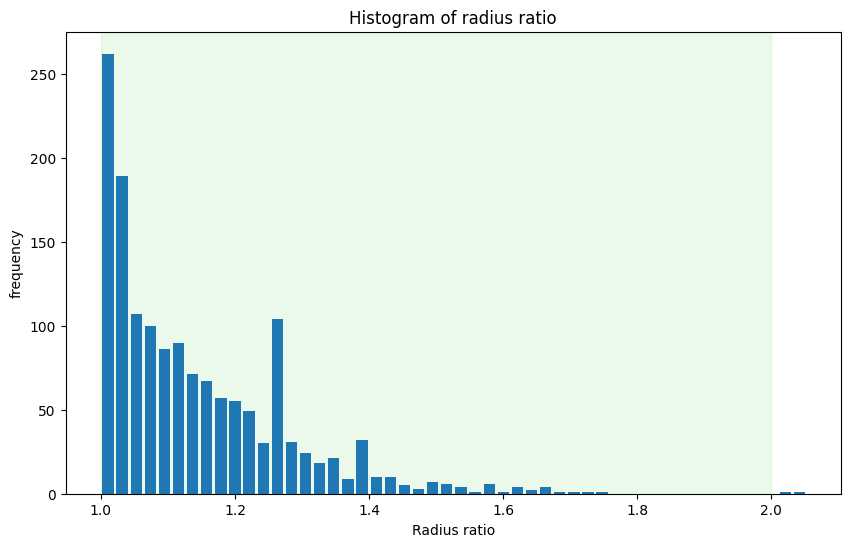
Ratio between radii
Another useful metric is the ratio between the inner and outer radius. For more info, see this link.
[7]:
metrics.histogram(triangle_mesh, metric='radius_ratio')
ax = metrics.plot2d(triangle_mesh, metric='radius_ratio')
triangle_mesh.plot_mpl(ax, **plot_kwargs)
[7]:
<AxesSubplot:title={'center':'triangle mesh'}>
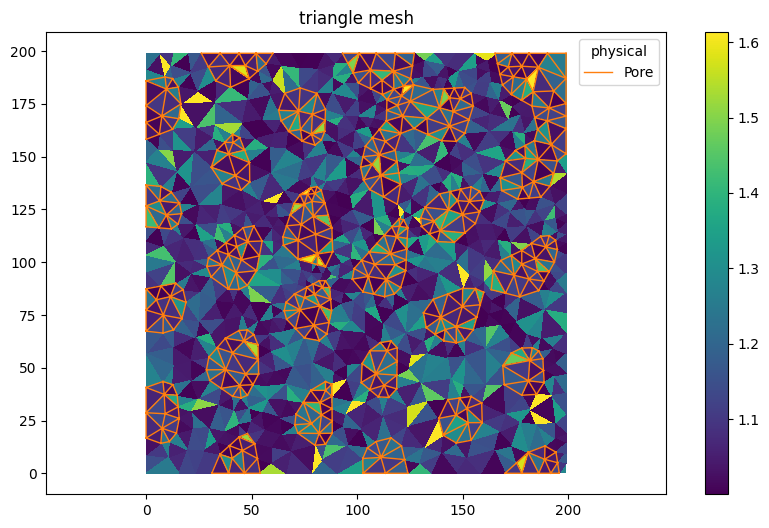
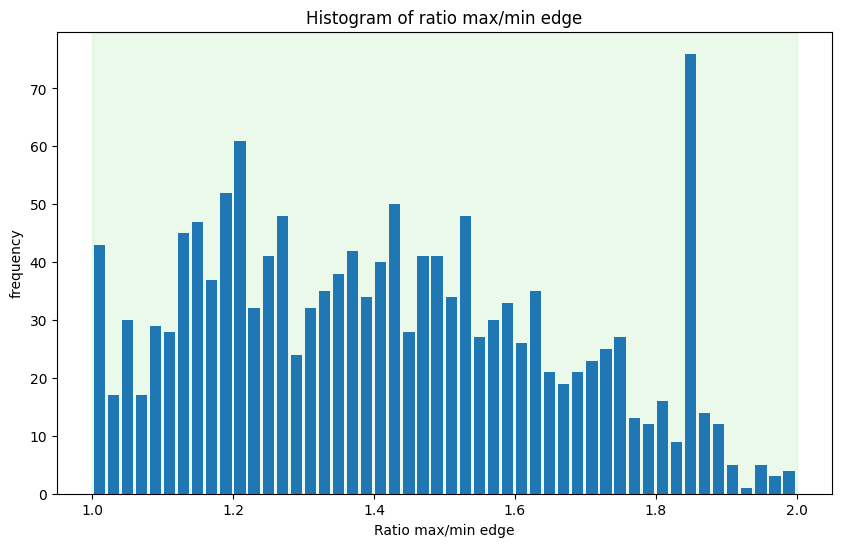
Ratio between longest and shortest edge
[8]:
metrics.histogram(triangle_mesh, metric='max_min_edge_ratio')
ax = metrics.plot2d(triangle_mesh, metric='max_min_edge_ratio')
triangle_mesh.plot_mpl(ax, **plot_kwargs)
[8]:
<AxesSubplot:title={'center':'triangle mesh'}>
Calculate and export all metrics
This way they can be viewed in another program like Paraview.
[9]:
metrics.calculate_all_metrics(triangle_mesh, inplace=True)
triangle_mesh.write("mesh_quality.msh", file_format='gmsh22', binary=False)
Warning: Appending zeros to replace the missing physical tag data.
Warning: Appending zeros to replace the missing geometrical tag data.